

- Go to the ROOT home page.
- Give a look at the main page, and then go to the section where you can download the recommended version of the program.
- Scroll down that page until you find your platform.
- If you have Windows XP or NT or 2000, this will do.
- Prepare a Martini, but go easy with Gin. I would also advise to use Beefeater's, but it's your pick.
- In the meantime, the 48.9 Mbytes should download to your PC.
- Once that is over, install ROOT. I cannot give specific instructions here, since these depend on your platform. However, the documentation is there to help you.
- Sip 10% of your Martini slowly.
- Open your favourite text editor (but now that you're at it, give a thought to downloading xemacs )
- Paste there the following piece of code:
void pexp (int Nexp=1000, int Ncases=10, double Nbgr=1000,
double Nsig=100, int Nbins=100, double xmin=-10., double xmax=10.,
double Nstart=100, bool fixmean=false, bool poisson=false) {
// Function pass parameters:
// -------------------------
// Nexp = number of pseudoexperiments to generate for each case
// Ncases = number of cases to study (each case is a different
// amount of background)
// Nbgr = number of background entries for the first case;
// further cases double that iteratively
// Nsig = number of signal entries to generate - it is fixed for all cases.
// Nbins = number of bins of the histogram to be generated
// xmin = minimum value of histogram - use -5 or -10
// xmax = maximum value of histogram - use +5 or +10
// Nstart = starting number of signal entries input to the fitter -
// typically use Nstart=Nsig or Nstart=0
// fixmean = true if you want to fit a Gaussian not moving its mean,
// false otherwise
// poisson = true if the total number of entries in the pseudoexperiments
// is varied within Poisson statistics
//
// Typical use case: Nexp=1000, Ncases=10, Nbgr=100, Nsig=100,
// Nbins=40, xmin=-10, xmax=10, Nstart=100,
// fixmean=false, poisson=false.
//
// The code generates a 2x2 graph if Ncases=1, showing the distribution
// of fitted signal entries and other info; if Ncases>1 a graph is produced
// of the returned signal entries fitted, as a function of the number
// of generated background.
//
// T.Dorigo, 24/4/2009 (from studies performed in 2000)
// ------------------------------------------------------------------------
gStyle->SetOptFit(111111);
gStyle->SetOptStat(1111);
double DNbins=(double) Nbins;
double f=sqrt(Nbgr*pow(2,Ncases));
TF1 * BS = new TF1 ("BS", "[0]+[1]/sqrt(6.283183)*exp(-0.5*(pow(x-[2],2)))",
xmin, xmax);
TH1D * PE = new TH1D("PE","Pseudoexperiment", Nbins, xmin, xmax);
TH1D * Results = new TH1D ("Results", "Number of fitted events",
100, -3*f-3*Nsig, 3*f+3*Nsig);
TH1D * Mean = new TH1D ("Mean","Mean of signal", 100, 2*xmin, 2*xmax);
TH2D * MeanvsNsig = new TH2D ("MeanvsNsig", "Mean vs Nsig",
100, xmin, xmax, 100, -3*f-3*Nsig, 3*f+3*Nsig);
TH1D * NSvsNB = new TH1D ("NSvsNB","Signal vs Bgr",
(int)(Nbgr*pow(2,Ncases)), 0., Nbgr*pow(2,Ncases));
// Loop on the number of cases for the amount of background
// --------------------------------------------------------
for (int Case=0; Case<Ncases; Case++){
cout << "Doing case of Nbgr=" << Nbgr << endl;
double countinterval=1000000./Nbgr;
// Handle case of Gaussian not moving around
// -----------------------------------------
if (fixmean) BS->FixParameter(2,0.);
// Pseudoexperiment generation and fitting
// ---------------------------------------
for ( int i=0; i<Nexp; i++) {
if ((float)i/countinterval==i/(int)countinterval)
cout << "Doing exp # " << i << endl;
PE->Reset();
BS->SetParameters(Nbgr/DNbins,Nsig/DNbins*(xmax-xmin),0.);
int N = Nbgr+Nsig;
// Handle choice of varying total number of entries
// ------------------------------------------------
if (poisson) N = gRandom->Poisson(Nbgr+Nsig);
// Fill histogram according to flat bgr and Gaussian
// -------------------------------------------------
PE->FillRandom("BS",N);
BS->SetParameters(Nbgr/DNbins,Nstart/DNbins*(xmax-xmin),0.);
// Do the fitting - Log-likelihood is "LL"
// ---------------------------------------
int status = PE->Fit("BS","LLOQ");
// Fill histograms with results of fit
// -----------------------------------
if (status==0) Results->Fill(BS->GetParameter(1)*DNbins/(xmax-xmin));
if (Ncases==1) {
MeanvsNsig->Fill(BS->GetParameter(2),BS->GetParameter(1)*DNbins/(xmax-xmin));
Mean->Fill(BS->GetParameter(2));
}
}
// Final calculations for summary graph of bias vs background
// ----------------------------------------------------------
double x=Nbgr;
double y=Results->GetMean();
double ey=Results->GetMeanError();
int ibinx=(int)(x)+1;
NSvsNB->SetBinContent(ibinx,y);
NSvsNB->SetBinError(ibinx,ey);
Nbgr=Nbgr*2;
}
// Graph plotting
// --------------
TCanvas * CC = new TCanvas ("CC","Results of Pexps", 800,800);
if (Ncases==1) {
CC->Divide(2,2);
CC->cd(1);
PE->Draw("PE");
CC->cd(2);
Mean->Draw();
CC->cd(3);
Results->Draw();
CC->cd(4);
MeanvsNsig->Draw();
} else {
CC->Divide(1,2);
CC->cd(1);
CC->GetPad(1)->SetLogx();
NSvsNB->SetMarkerStyle(20);
NSvsNB->SetMinimum(0.8*Nsig);
NSvsNB->Draw("PE");
}
CC->Print("pexp.ps");
}
Code ends here. I mean this line should not be pasted, ok ?? Now, save the above text as "pexp.C" in the "Macro" folder of your ROOT directory (the one created when you downloaded the program).
You are basically done. Now you can just launch ROOT (you should have been provided with a suitable desktop icon if you downloaded the windows version; on Linux, you just need to type "root" from the command line if you are in the proper directory; but as I said, refer to the download instructions in that case).
ROOT will open a black window with a command-line prompt showing something like the following:

Now you have to load the macro you have previously saved from the editor:
root[0] .L pexp.C
and launch the pseudoexperiment generation and fitting! Below the case for 1000 pseudoexperiments, one single background case of 1000 entries, with 100 signal entries, all put into 50-bin histograms spanning the range -10 : +10, and with variable-mean Gaussian signal shapes, and no Poisson fluctuations of the number of entries:
root[1] pexp(1000,1,1000,100,50,-10.,10.,10,false,false);Sit back and sip the rest of your Martini. In a minute you will get a graph like the one below:
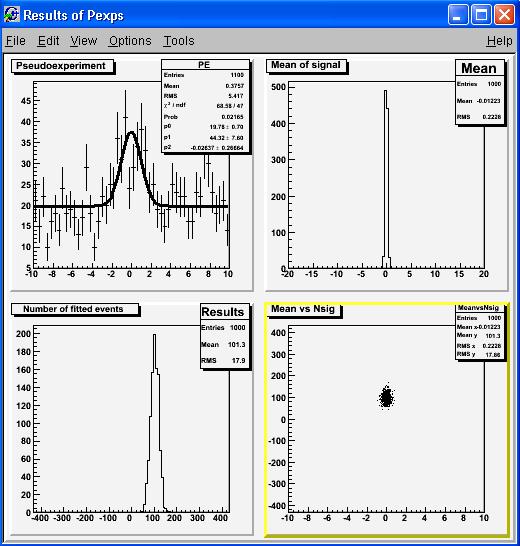
The meaning of the graphs should be clear to you, since they have been already discussed on the previous post... At this point, you can really start playing with the tool. First of all, you can try doing more than one single case for the number of background events -this will produce a wholly different graph. Or you can change the number of bins (dumb), the range (also not too informative), change the signal function (a bit more complicated, but there is only one line in the macro where you need to change things), or experiment with different use cases. I will be glad to discuss your own findings here, but be advised that there are indeed many subtleties in the matter!


Comments