

The problem is that often, upon observing a odd phenomenon, we are usually unable to correctly take into account the a-posteriori nature of our attempts at estimating the probability of our observation. This is sometimes called "look elsewhere effect" in some instances, but the issue is more general.
Two basic concepts
To clarify what I am getting at, let me first introduce two concepts. The first is the "flatness" of a p-value. If you choose at random a number between zero and one, and your random number generator is unbiased, the number has the same probability to be in the range [0,0.01] as to be in the range [0.49,0.50] or [0.99,1.00]: this probability is in fact one hundredth in all cases. We call this a "flat distribution", or more correctly "uniform distribution".
The second idea is that usually when we get some data we perform some test on it, which returns a p-value: this again is a number between zero and one, which says how likely it is that the data distributes as observed, if our model is true. By "model" I am referring to any underlying physical theory which we call our "null hypothesis". It could be the Standard Model, and the data could be some reconstructed particle mass distribution which, in the presence of new physics, should depart from the model we fit through them.
P-values in HEP
Now, what we generally do upon getting a p-value from some fit to some data is to compare it with a pre-defined threshold value: if it is below 0.0017 we call the observed effect a "three-sigma" one; if it is below 0.00000027 we call it a "five-sigma" one (the jargon is due to the correspondence of those values with tail integrals of a Gaussian distribution from 3-sigma to infinity, or from 5-sigma to infinity). It is clear from this that a three-sigma effect can sometimes occur in data that are indeed drawn from our model; while a five-sigma effect is usually a sufficient indicium to claim that the model is false, and that we have e.g. discovered a new particle not included in it.
What do we do, then, if we instead than a single p-value our experiment is designed to produce several (such as is the case if e.g. we are testing not just one mass distribution, but several independent kinematic distributions together) ? We need a prescription to combine them, because the number of questions we may end up asking ourselves upon observing these p-values grows geometrically with their number!
Fun with p-values
Among the questions one might be tempted to ask, upon getting several p-values, are the following:
- what is the probability that the smallest of them is as small as the one I got ?
- what is the probability that the largest one is as I observed it to be ?
- what is the probability that the product of the numbers is as small as this ?
Please note: your inference on the data at hand strongly depends on the check you perform, for a given set of data!
In case you believe that each of your, say N, p-values tells you something about the truth of the null hypothesis you are testing, you may want to avoid concentrating on any subset of the set, and just use them all together. A reasonable (but not the optimal!) thing to do is to then check for how small is the product of the N numbers. There is then a very handy formula that provides the cumulative distribution of the density of x = p1*p2*...*pN. This can be derived by induction (see e.g. Byron Roe, "Probability and Statistics in Experimental Physics", Springer-Verlag 1992, p.129) and is equal to
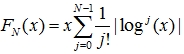
Above, N is the number of observations; j runs from 0 to 4; and x is the product of the N observations. The exclamation mark is the symbol of the factorial [j!= j*(j-1)*...*2*1]. Note that the formula is blind to the individual values, as it should: it only cares for the number of them and the product.
Let us check this formula with a simple case. We take five really uniformly distributed p-values for a start: p1=0.1, p2=0.3, p3=0.5, p4=0.7, p5=0.9 (note that the ordering is inessential here). The product of the five numbers above is 0.00945, and the use of the formula above gives that the probability of obtaining a product as small as this is P(0.00945|N=5) is 0.5017. As expected, the distribution is flat and we should find a combined probability which does not scream at anything abnormal.
Now let us take instead p1=0.00001 and the other numbers as above. The product is 0.000000945, and P(0.000000945|N=5) is 0.00123. So there is about a chance in a thousand that the product is as small as that. Note that one in a thousand is a rather large outcome, given that one of the numbers is as small as a hundred thousandth! One might (correctly) think that the chance of getting one in five numbers as small as 10^-5 is only few times in 10^-5. But that is not what we tested!!! We are testing the product, not how small is the smallest number.
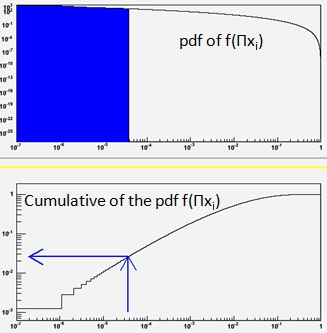 Finally, let us take p1=0.05, p2=0.10, p3=0.15, p4=0.20, p5=0.25. The test of the product gives P(0.0000375|N=5)=0.0258. This is shown pictorially on the right: the lower graph shows the cumulative distribution of the product of five numbers, the x axis giving the product and the y axis giving the global p-value; the upper graph shows the probability density function of the product of five numbers distributed flatly between zero and one.
Upon getting a 2.58% probability that the five numbers are as given above, you may be tempted to say that they do not give strong evidence against the null hypothesis (which, I remind you, is that the numbers distribute uniformly between zero and one). You might want to compare this conclusion with the one you would get if you had been asking "what is the chance that five numbers between zero and one are all smaller than 0.25?", which is a totally different question than the one on the product. The answer to the above is P=(0.25)^5 = 0.00098, a much smaller probability! This is a sample demonstration that the a-posteriori choice of the test is to be avoided at all costs. Alas, a lesson which is still needed in HEP occasionally!


Comments